Evidence-Based Data Visualization
Audrey Michal
February 21st, 2020

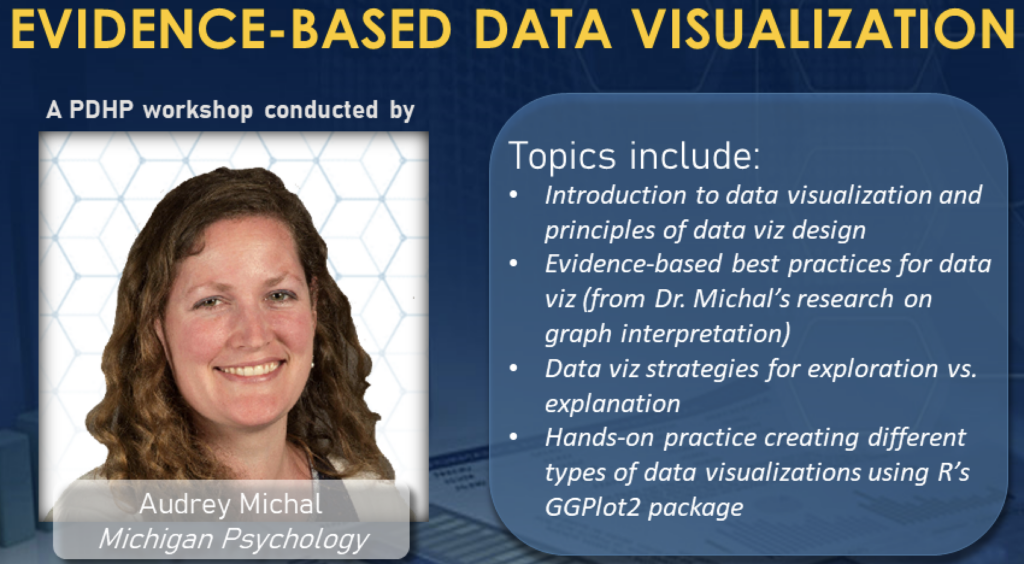
PDHP kicked off our 2020 workshop series on Feb. 21st, with a workshop entitled Evidence-Based Data Visualization, presented by Dr. Audrey Michal of the Michigan Department of Psychology. This half-day workshop provided a general introduction to data visualization techniques, while introducing a unique evidence-based approach to data viz design (based on Dr. Michal’s research on visual routines in graph comprehension and interpretation), and different data visualization strategies for data exploration versus data explanation. Attendees received hands-on practice creating different types of data visualizations with R software, using GGPlot2 and other state-of-the-art R packages. As always, this workshop was free and open to the public.
Topics include:
- Introduction to data visualization and principles of data viz design
- Evidence-based practices for data viz (from Dr. Michal’s research on graph interpretation)
- Data viz strategies for data exploration vs. explanation
- Hands-on practice creating different types of data visualizations using R’s GGPlot2 package.
Slides & Lab Materials:
–Slides are available for download here
–Sample dataset used in the workshop is here
Software:
–R software (required)
–R Studio (strongly recommended)
## install packages
install.packages(c("ggplot2","gganimate", "gifski","ggmap","lubridate"))
